Visualizing Mathematical Equations and Operations
Capture the Essence of an Equation and Solve it Visually by Using Mathematical Graphs

Before we get started on this rather visual investigation into the nature of equations, we need to recall that an equation is a relation and that relation can be written down in more than one way.
Throughout this article, it is important that you let go and forget about the old conventions that you learned long ago because this is a completely new (at least for me) way of thinking.
Introduction
At school, many of us learned that an equation is like a old scale in balance.
You need to keep the balance, so if you add a number on one side, you need to add the same number on the other side. The same goes, of course, for other operations.
This means that an equation, even though it says really one single thing, can be represented in more than one way. For example, let’s take a look at the equation a + b = c where a, b, and c are arbitrary numbers satisfying this equation.
This relation can actually be represented in three different ways, namely
- a + b = c
- a = c - b
- b = c - a
Note that in all three representation of this relational object, a and b displays a symmetrical relationship in that you can permute them (swap them) without changing the relation itself.
If you swap them in the first equation, the representation stays the same because a + b = b + a, if you swap them in the second equation, you get the third and vice versa, but you don’t change the relation (the truth of the equation).
Note that this is not true if you swap a and c!
There must be a way of displaying that symmetry together with all the representations in one single object that then comes with some rules about the asymmetries.
Guess what. There is!
Visualizing Equations
I suggest using mathematical graphs.
A graph consists of nodes and edges (relationships) connecting the nodes.
For example, you can view a social network like Facebook as a huge graph with people as nodes and friendships as edges.
The nodes and edges in our equation-graph is gonna be numbers and operations between the numbers, respectively. In this way, we encapsulate all the representations in one object.
Let me give you the new notation and then explain to you why it is so awesome.
The below graph (triangle if you wish) represents the equation a + b = c.
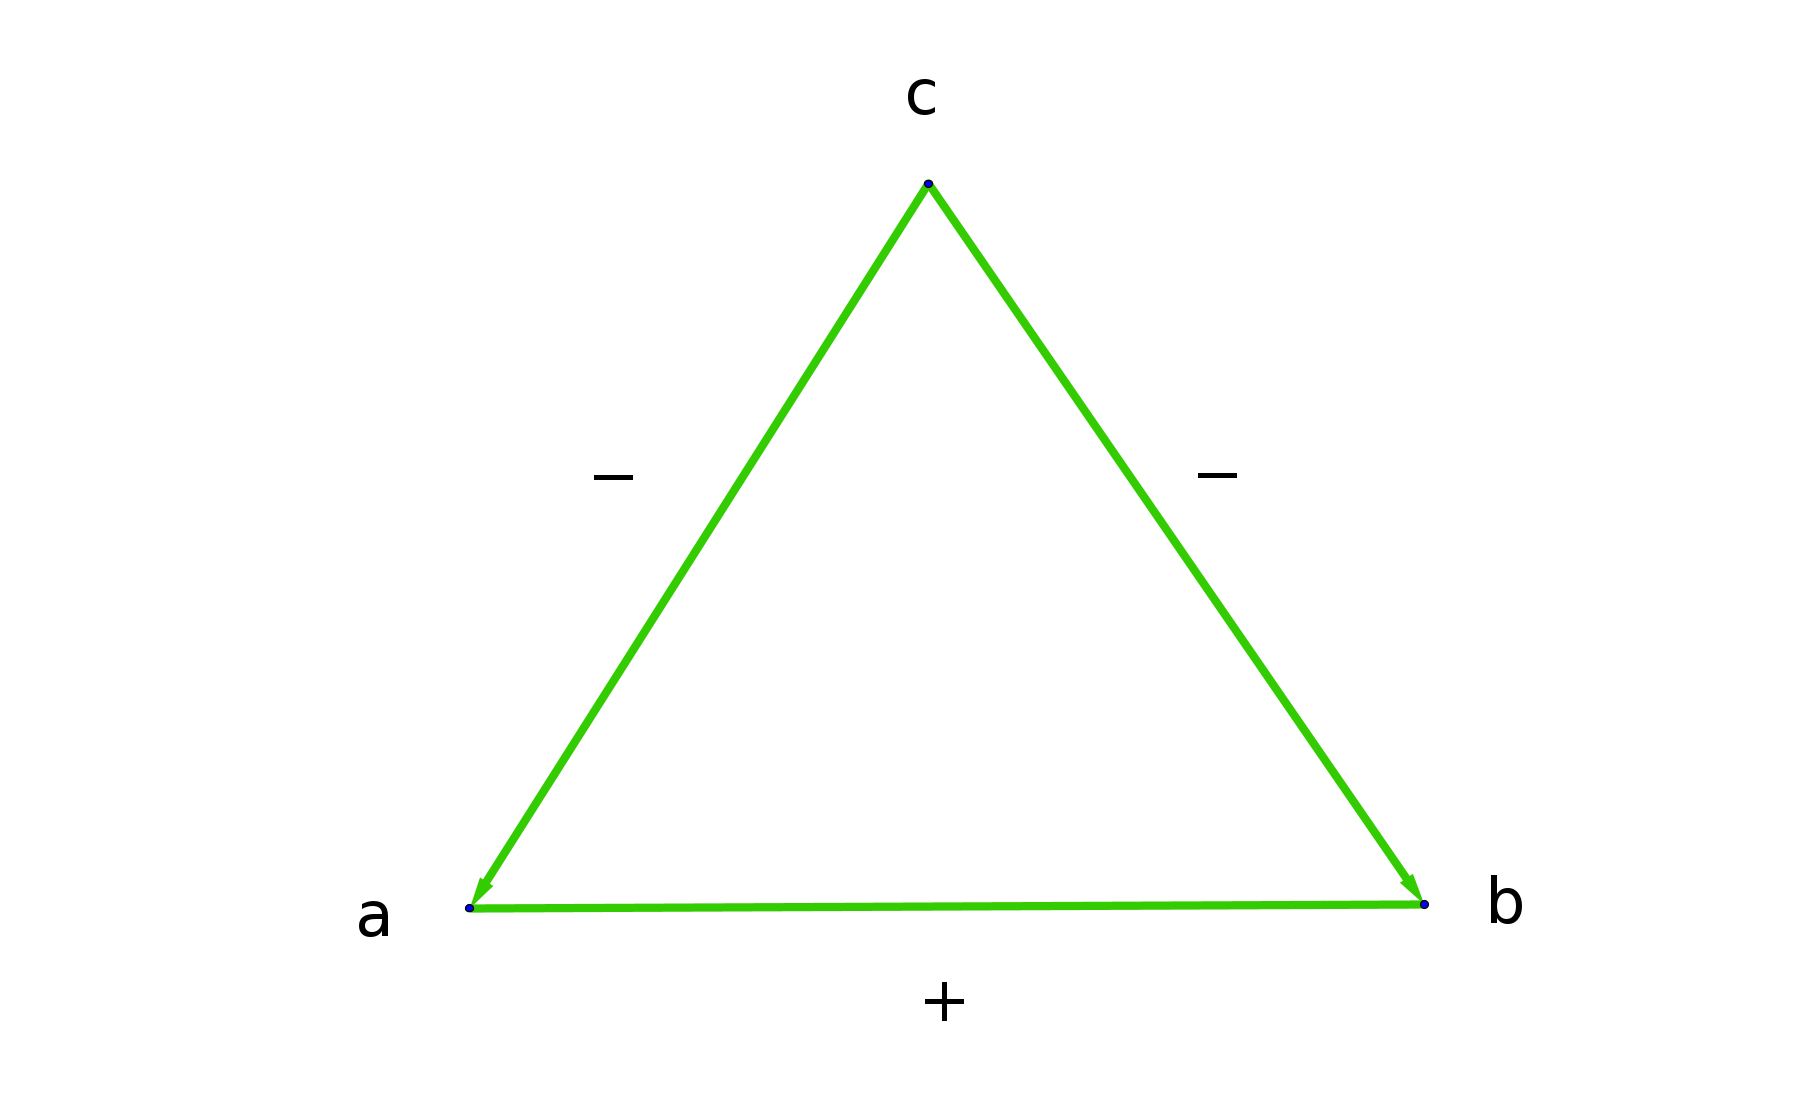
First of all, notice that the edges from c are directed (if you look closely) in the form of arrows pointing to a and b.
This display the asymmetries between c and the two other numbers.
Let’s call this an additive graph.
So how do we read this?
You can read this graph in three ways. The rule is that if you follow an edge between two nodes (numbers), then whatever that sum or difference corresponds to equates to the remaining number.
For instance, in the above triangle. If we follow the directed edge from c to a then it says that c - a = b, if we follow the other directed edge from c to b it says c - b = a, and if we follow the edge connecting a to b in either direction we will get a + b = c.
I think that this is already a good mnemonic rule for learning young pupils how to solve equations.
How about if both sides of the equation contain operations?
Below is the graph for the equation a + b = c + d.
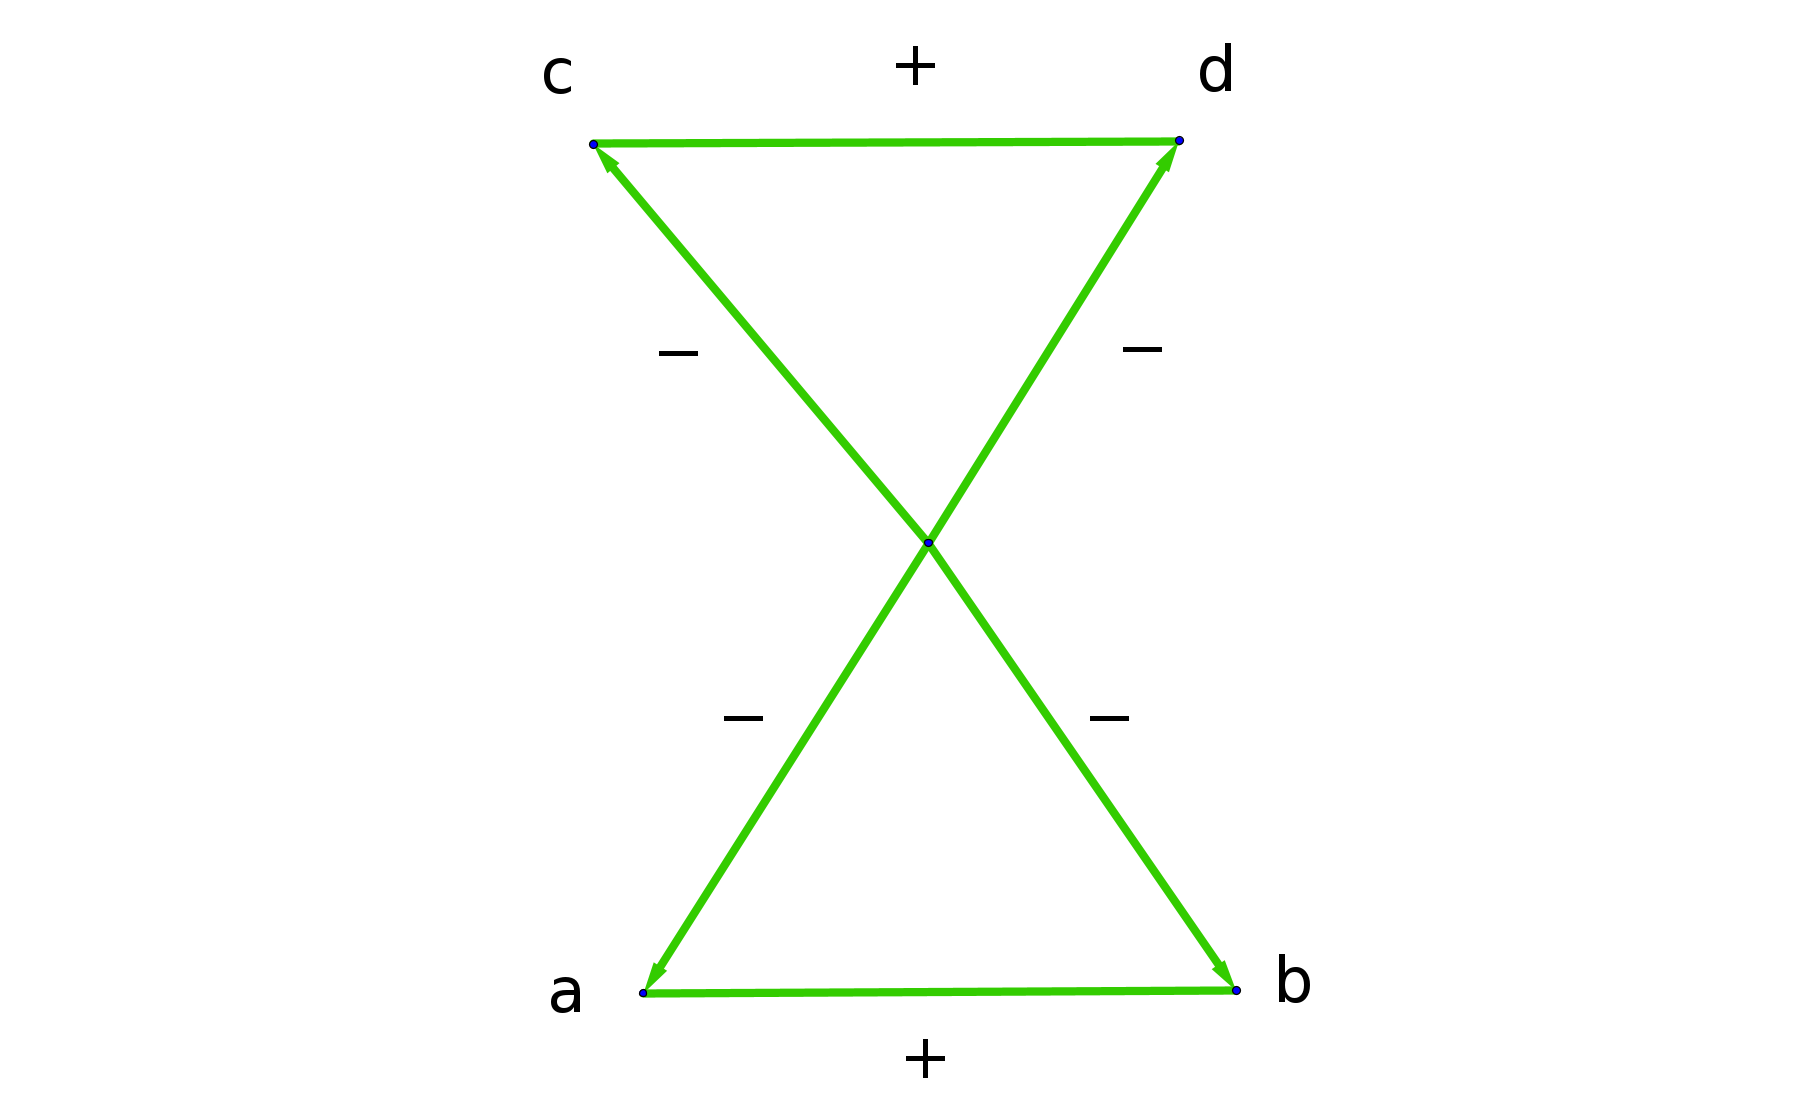
Notice how well this aligns with the above logic e.g. whatever a + b is, it is represented by the empty node in the middle and if we follow the node from the empty node to the number d afterward then this is saying that a + b - d = c.
We are not going to stop here. We have another triangle with exactly the same pattern but with different operations — the multiplicative graph.
Imagine that we have an equation of the form a⋅ b = c. This again has three representations.
- a ⋅ b = c
- a = c / b
- b = c / a
Let’s represent these relationships in the following graph.
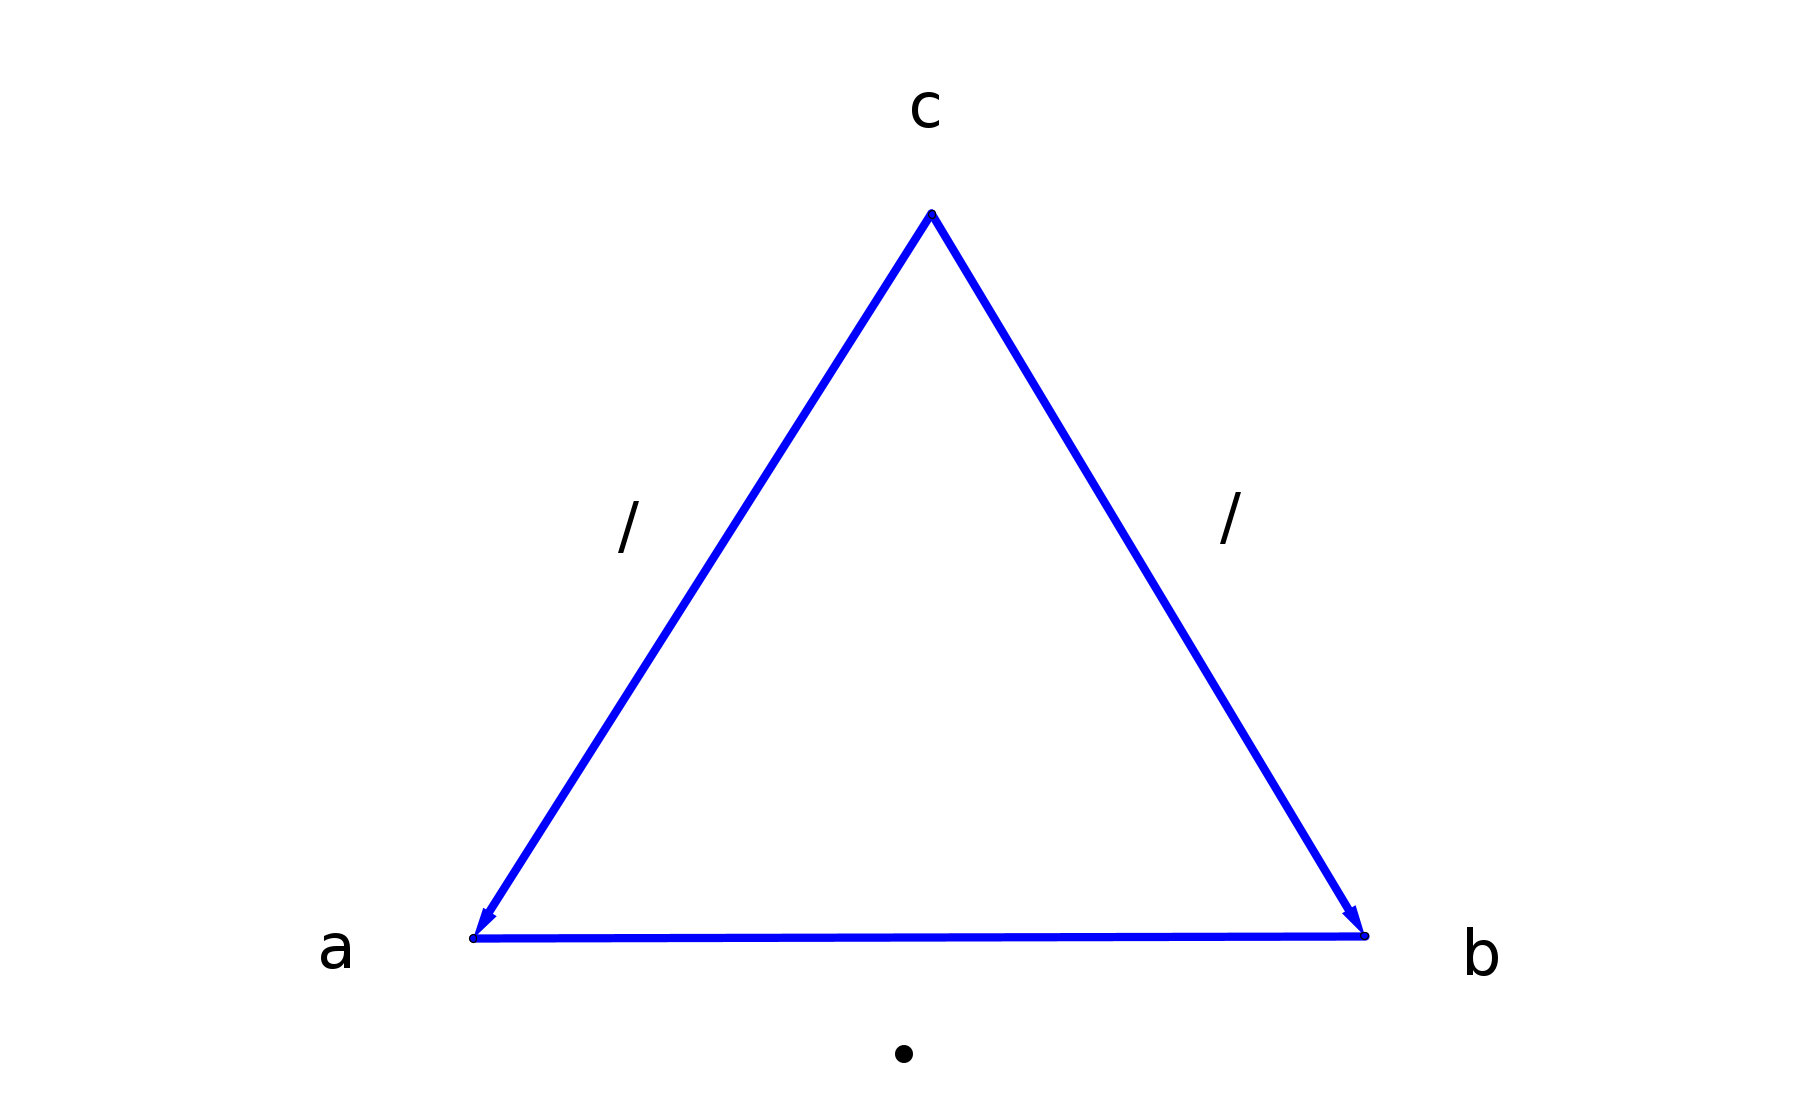
We don’t need to color code the graphs but it is going to be a help a little later as you will see soon.
Notice again the symmetry between a and b as well as the skew symmetry between a and c, and b and c.
Of course, the same rules apply to this triangle i.e. we follow an edge and the calculation that it corresponds to is equal to the remaining node.
You can check that this rule makes sense in this graph as well.
Let’s combine them and solve an equation, that corresponds to finding a formula for the x-coordinate in terms of the y-coordinate of a line.
Solving Equations and Writing Down Identities
Say we have the following equation that we need to solve for x:
ax + b = y.
We will solve this in just one step with our new tool!
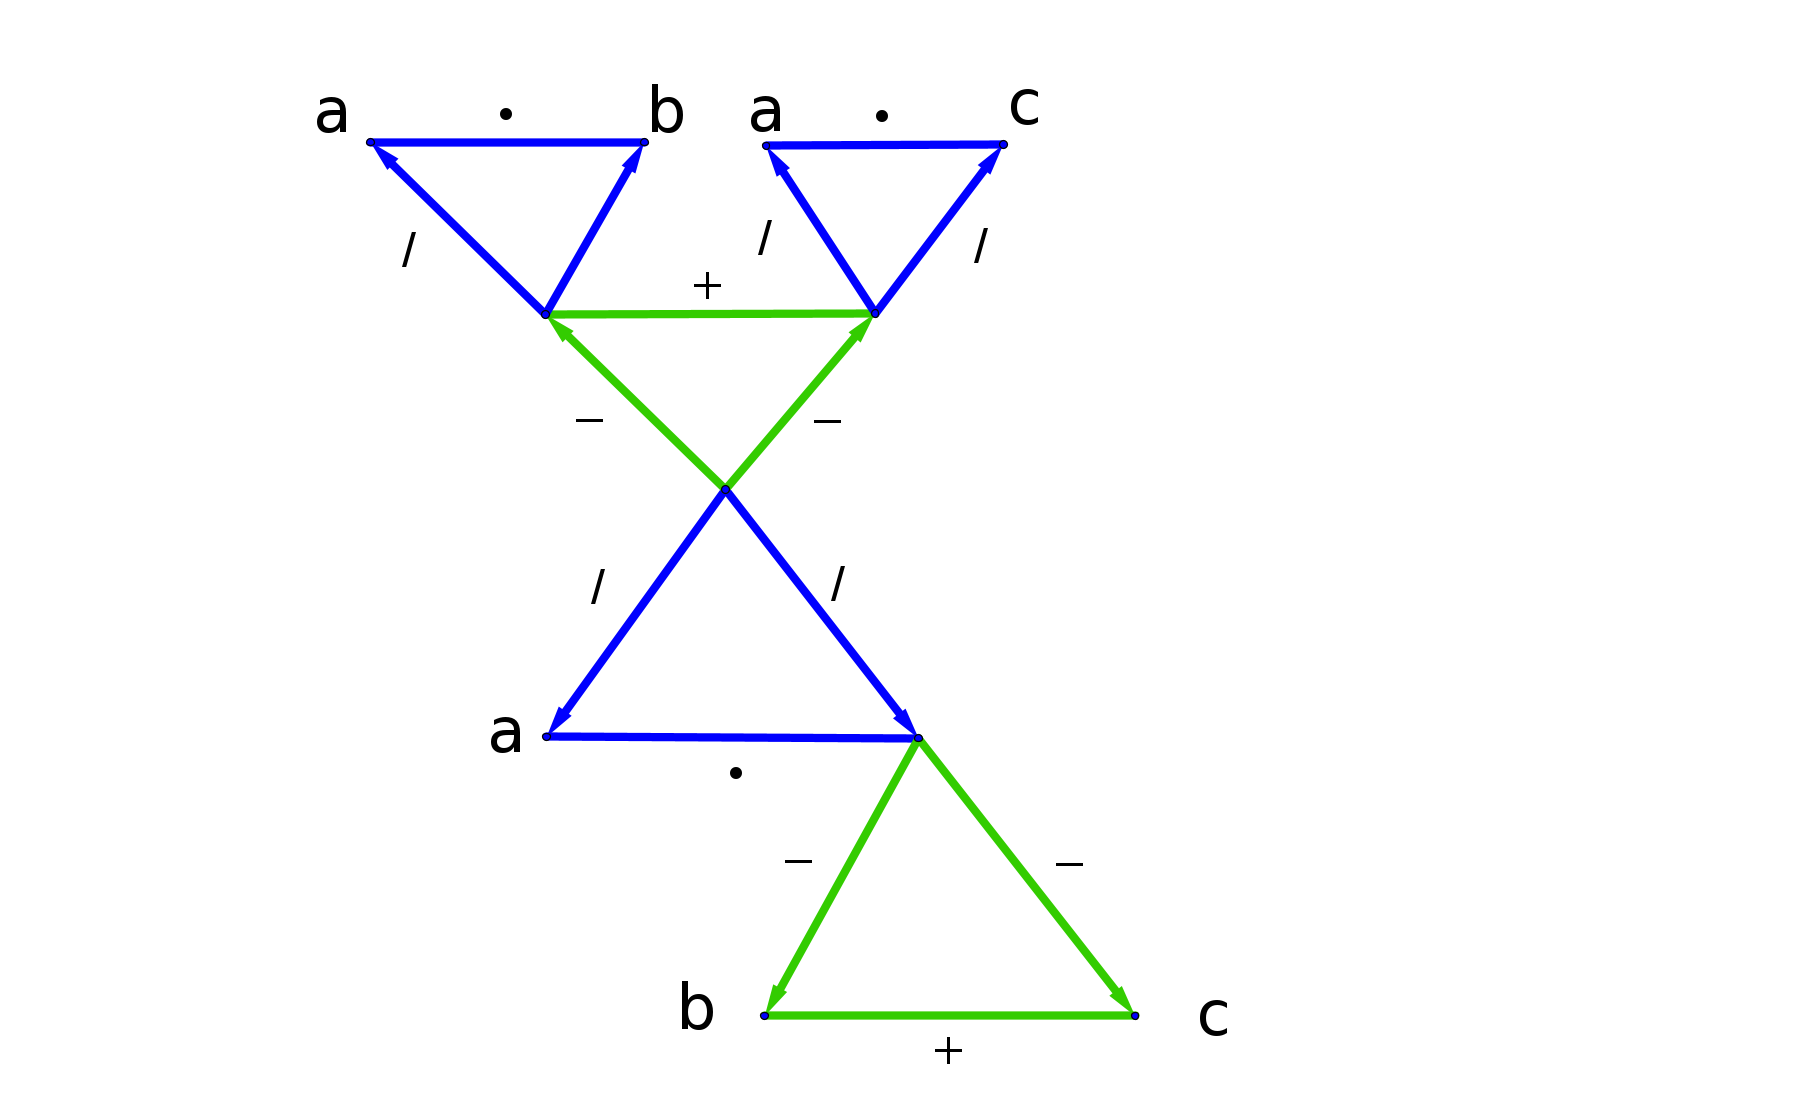
Let us see what this equation actually looks like in our graph universe.
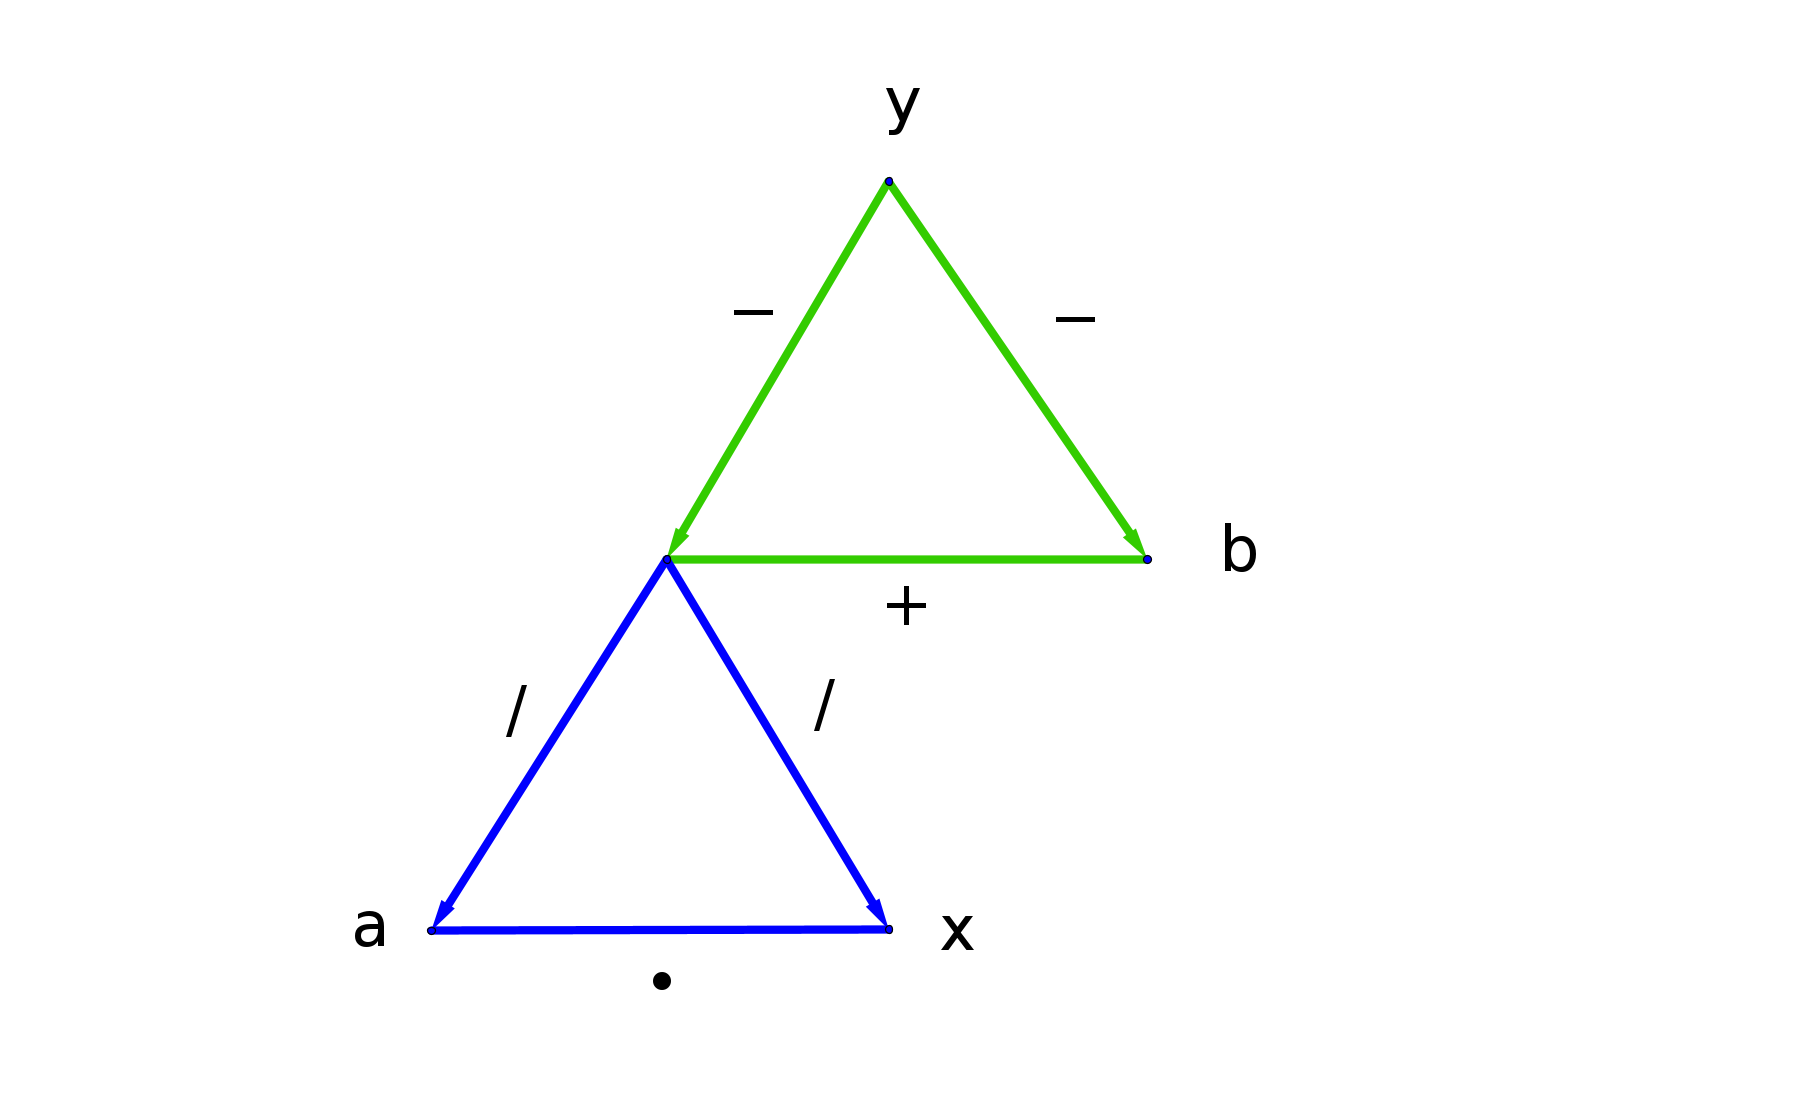
The logic here is that whatever the value of ax is (represented by the unlabeled vertex at the top of the multiplicative triangle, if we add it to b we get y.
Now we can collapse the additive triangle down to the unknown blue vertex by following the edge from y to b. We get
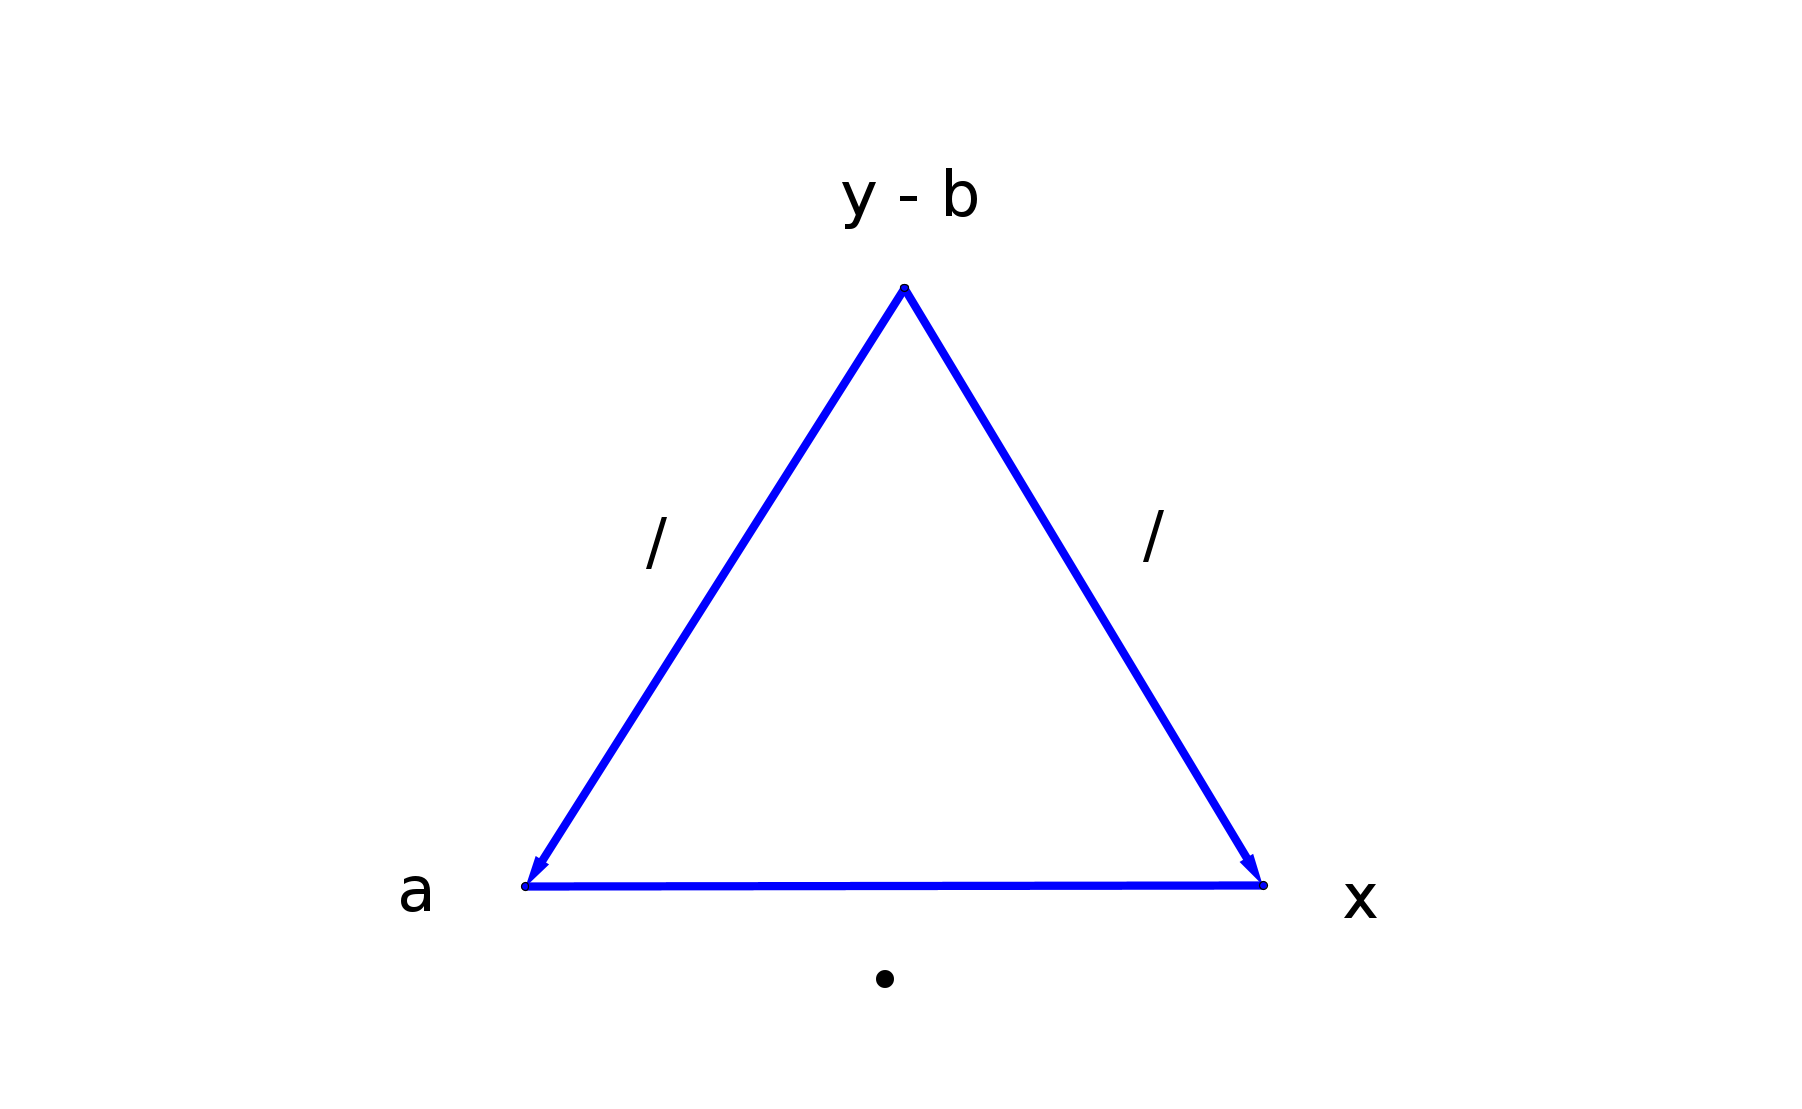
and we can read the answer directly from this triangle by following the edge from y-b to a.
x = (y - b) / a.
The Rules of Arithmetic
Many laws have just become second nature to us. These laws however are not on our backbone in this triangle universe, so we need to familiarise ourselves with them in order to become effective at solving equations with them.
Let’s state some laws and write them down in our new visual language.
We have for instance the associative law, namely a + (b + c) = (a + b) + c.
This can be formulated in one single graph.
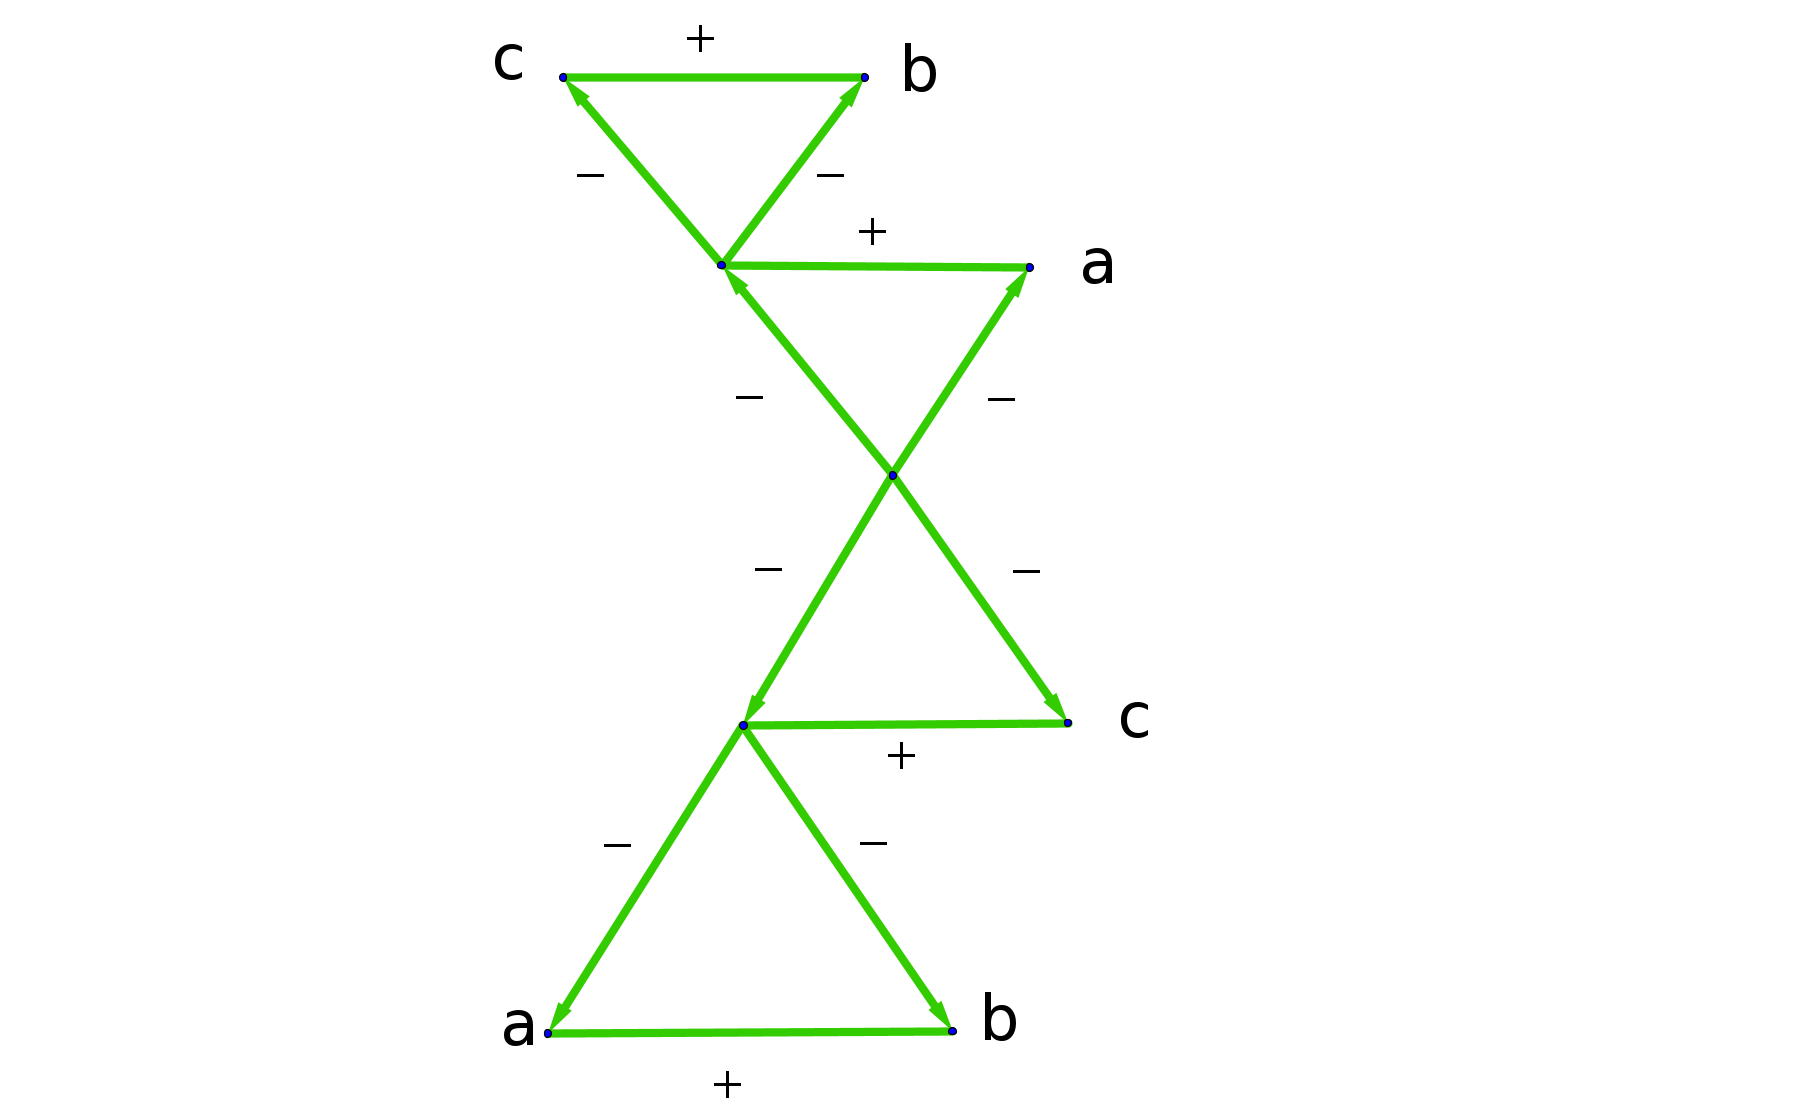
In the same way, we can write the distributive law a ⋅ (b + c) = a ⋅b + a ⋅ c as
You can find other laws yourself if you want.
Rules of Fractions
There is something that we haven’t discussed yet. And that is the following:
What happens if you permute two numbers in an asymmetrical relationship?
Well, let’s take a look at the “a + b = c” -triangle.
If we swap a and c for instance, then the equation would not hold anymore, however, if we replace b by its inverse (in this additive case, by -b) then the triangle would display the right relationship.
Compare the above triangle to the following:
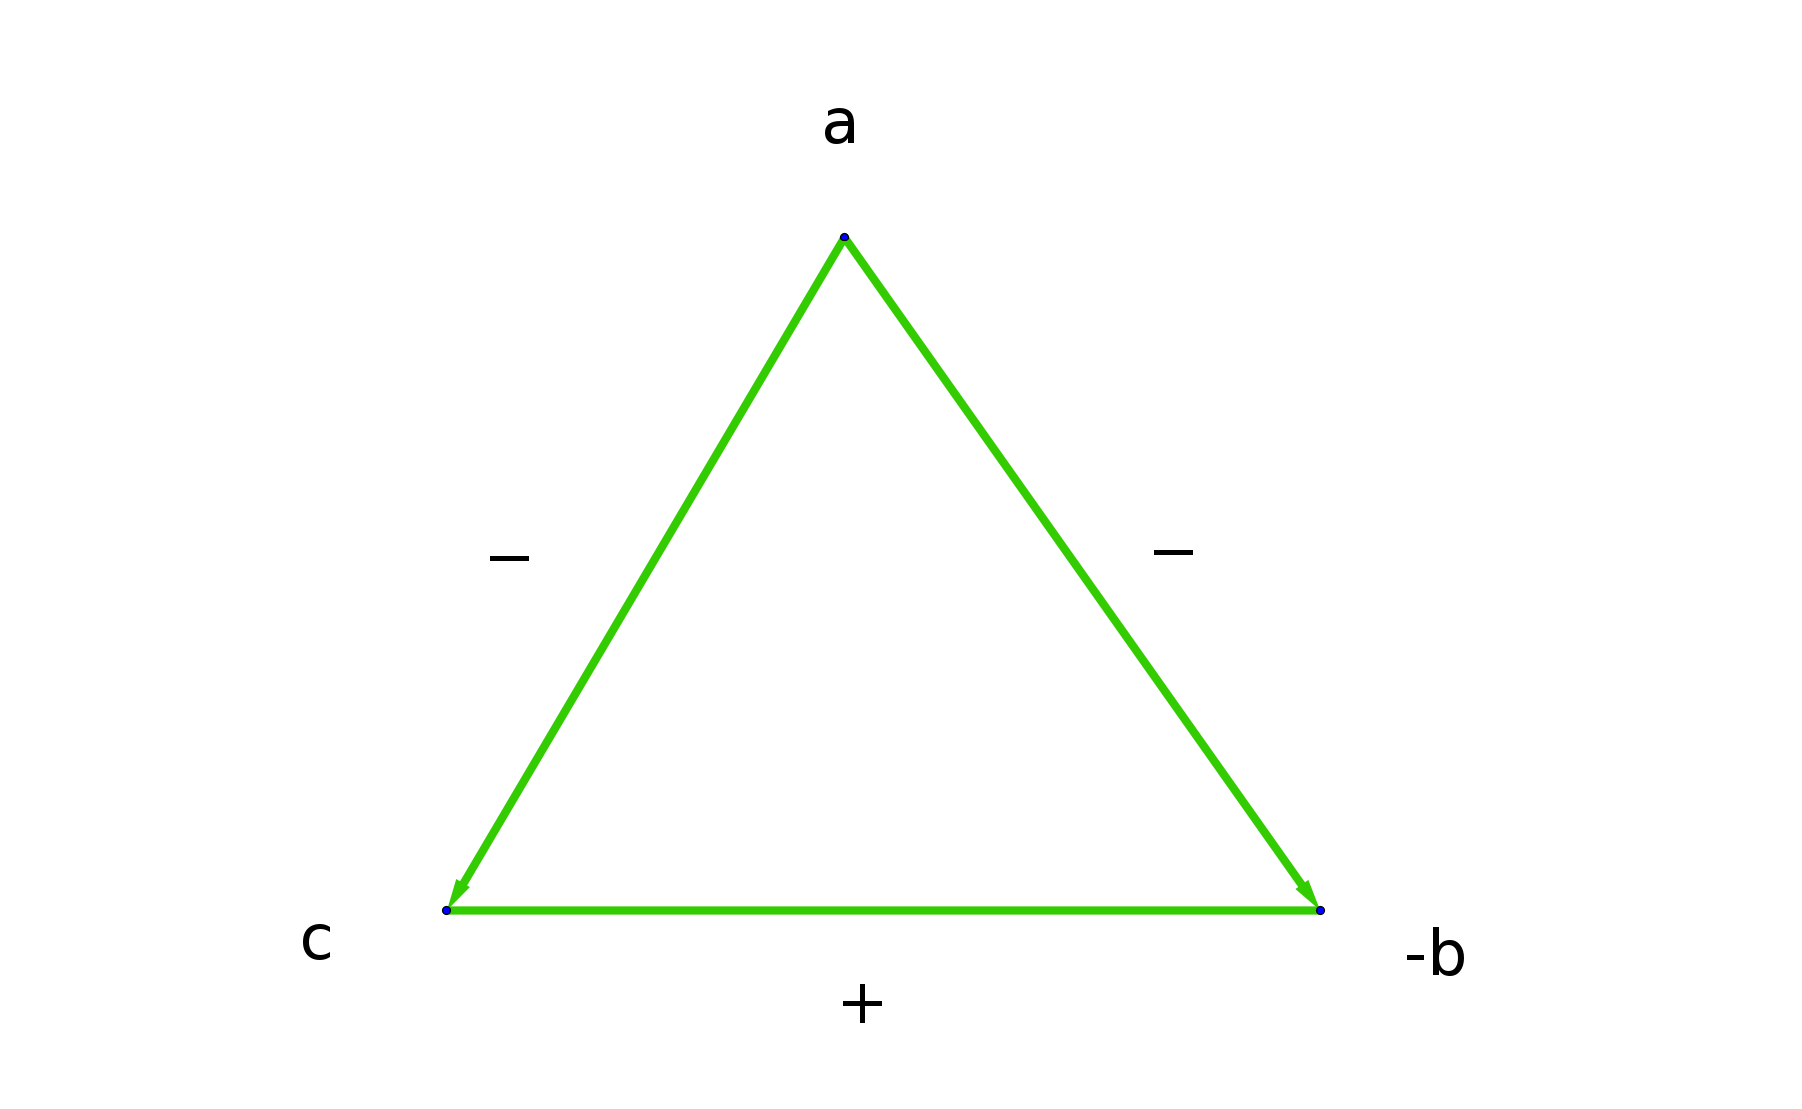
This triangle is of course saying that
- a - c = -b
- a - -b = a + b = c
- c + -b = c - b = a
And guess what, this antisymmetry also holds in the multiplicative triangle with the respective (multiplicative) inverse . Recall that the inverse (reciprocal) of a fraction a/b is b/a. You simply swap the numerator and denominator to get the inverse rational number.
Say you’ve forgotten how to divide a number by a fraction i.e. what is c/(a/b)? but you remember that ac/(bc) = a/b.
Well, here’s a trick.
The reduction rule ac/(bc) = a/b (which, recall, can be written c(a/bc)) can be written in the following way:
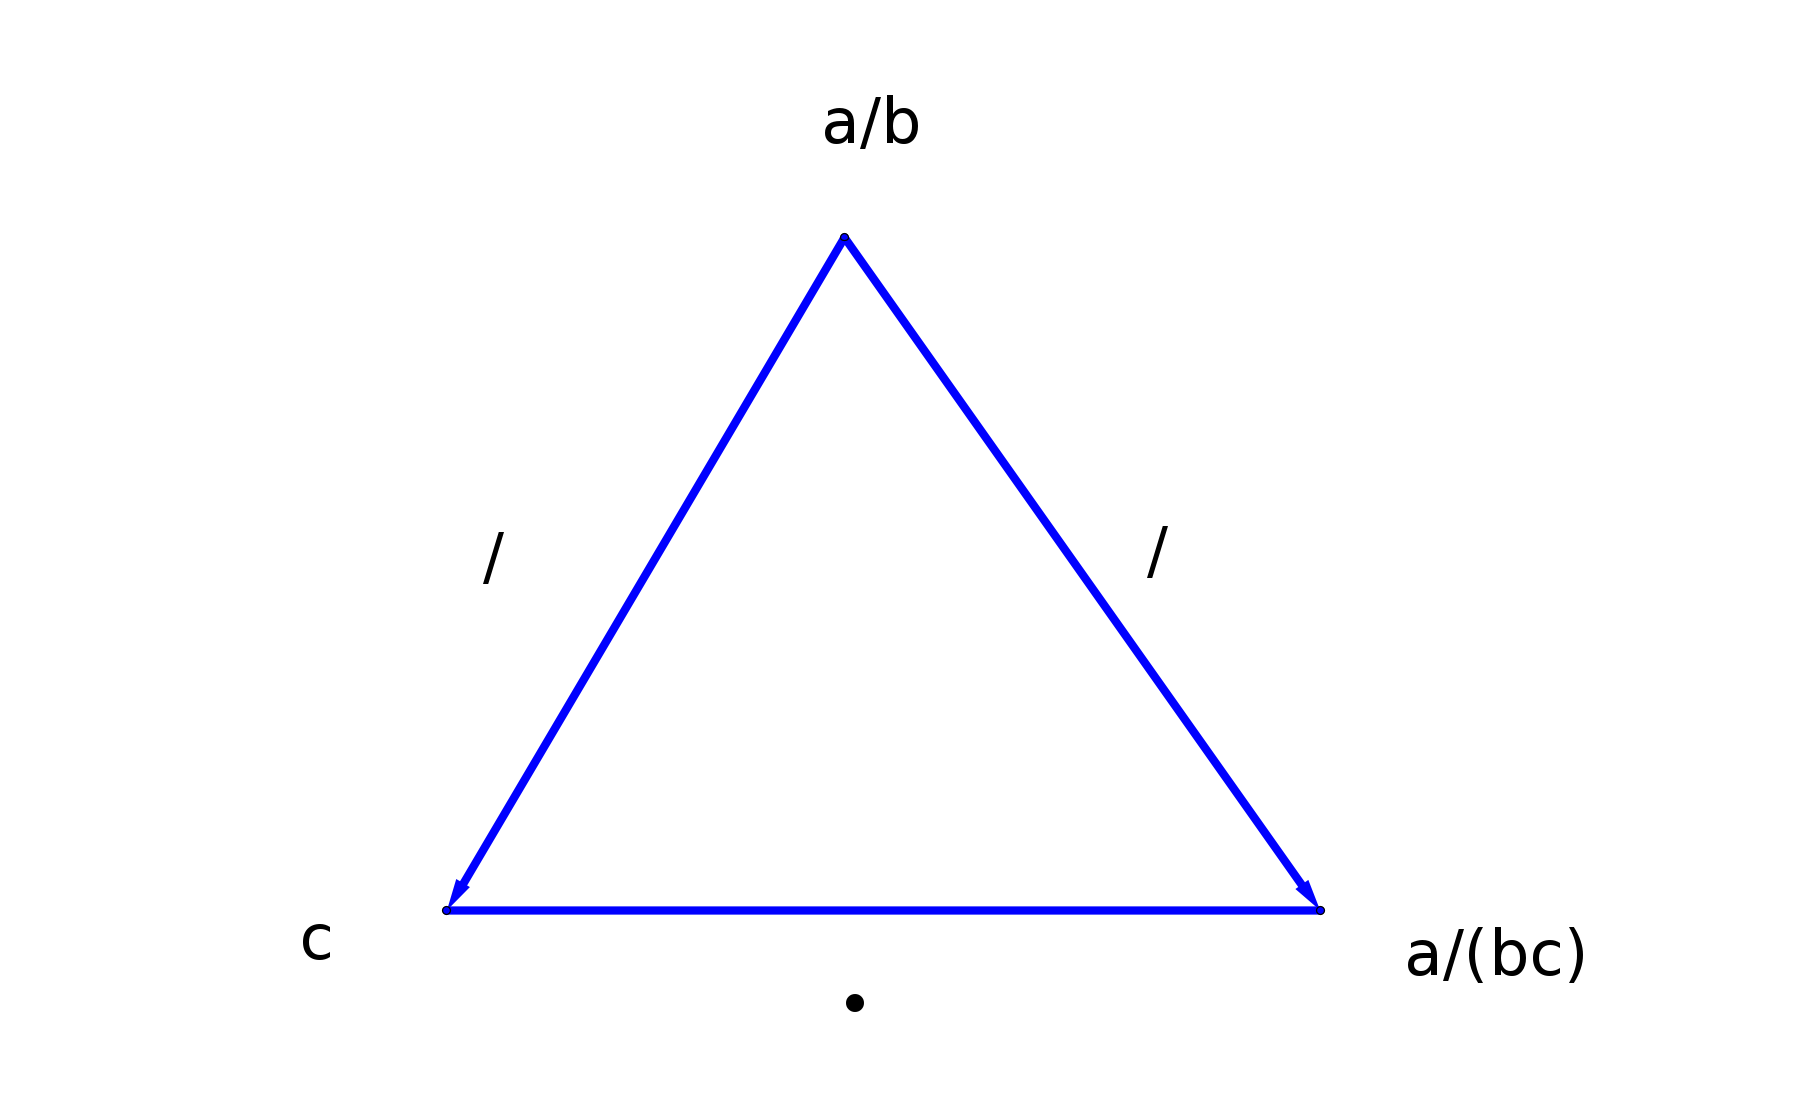
Notice that straight away you get for free how to divide a fraction by a number by following the edge from a/b to c i.e. (a/b)/c = a/(bc).
This was not what we were after, but we’ll have a free meal, right?
By the asymmetric rule from above for multiplicative triangles, this is equivalent to the following:
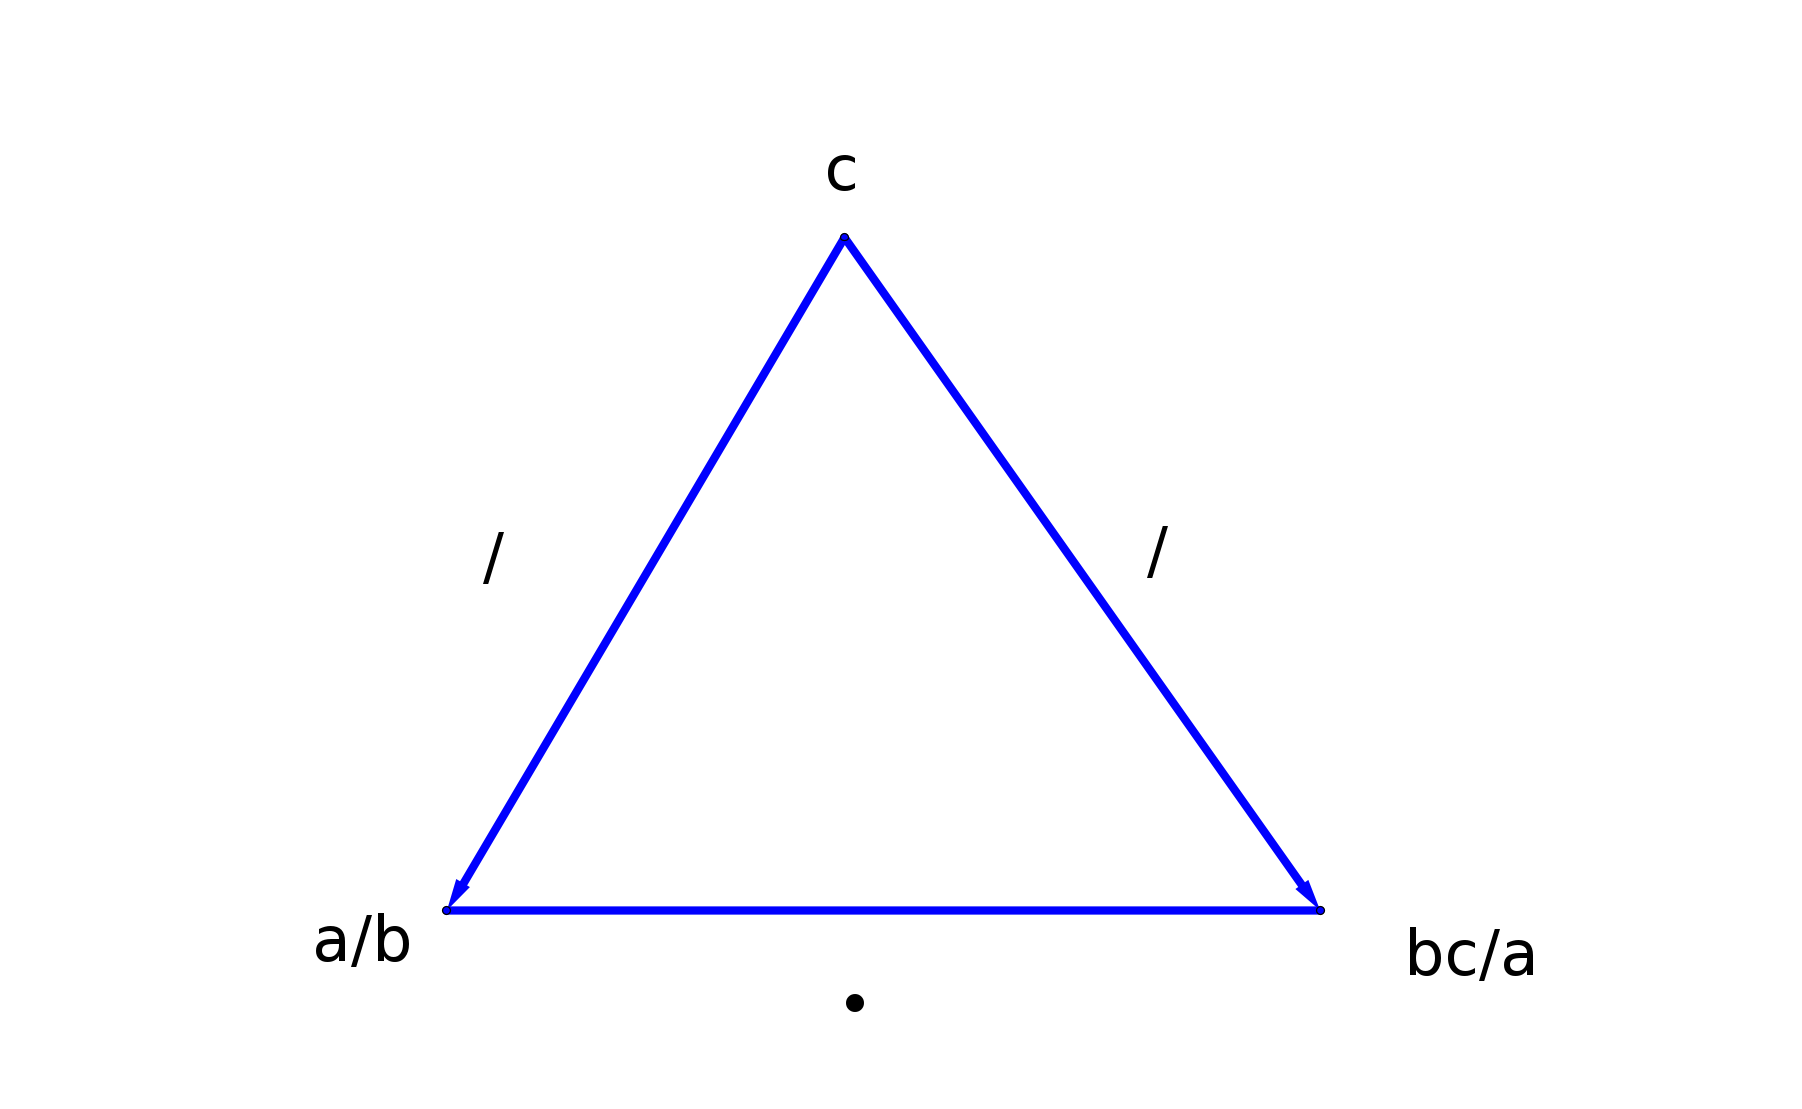
and this is exactly saying that c/(a/b) = bc/a and this is of course the rule for dividing by a fraction (you multiply by it’s inverse).
We have only just scraped the surface of this way of solving equations and there are probably many interesting patterns to explore. I suggest you go do that. At least I will.
How about exponentiation? Glad you asked! This is for the next article where we are going to explore a completely asymmetrical triangle connecting powers, roots, and logarithms.

Written by